Sales Dashboard 📊
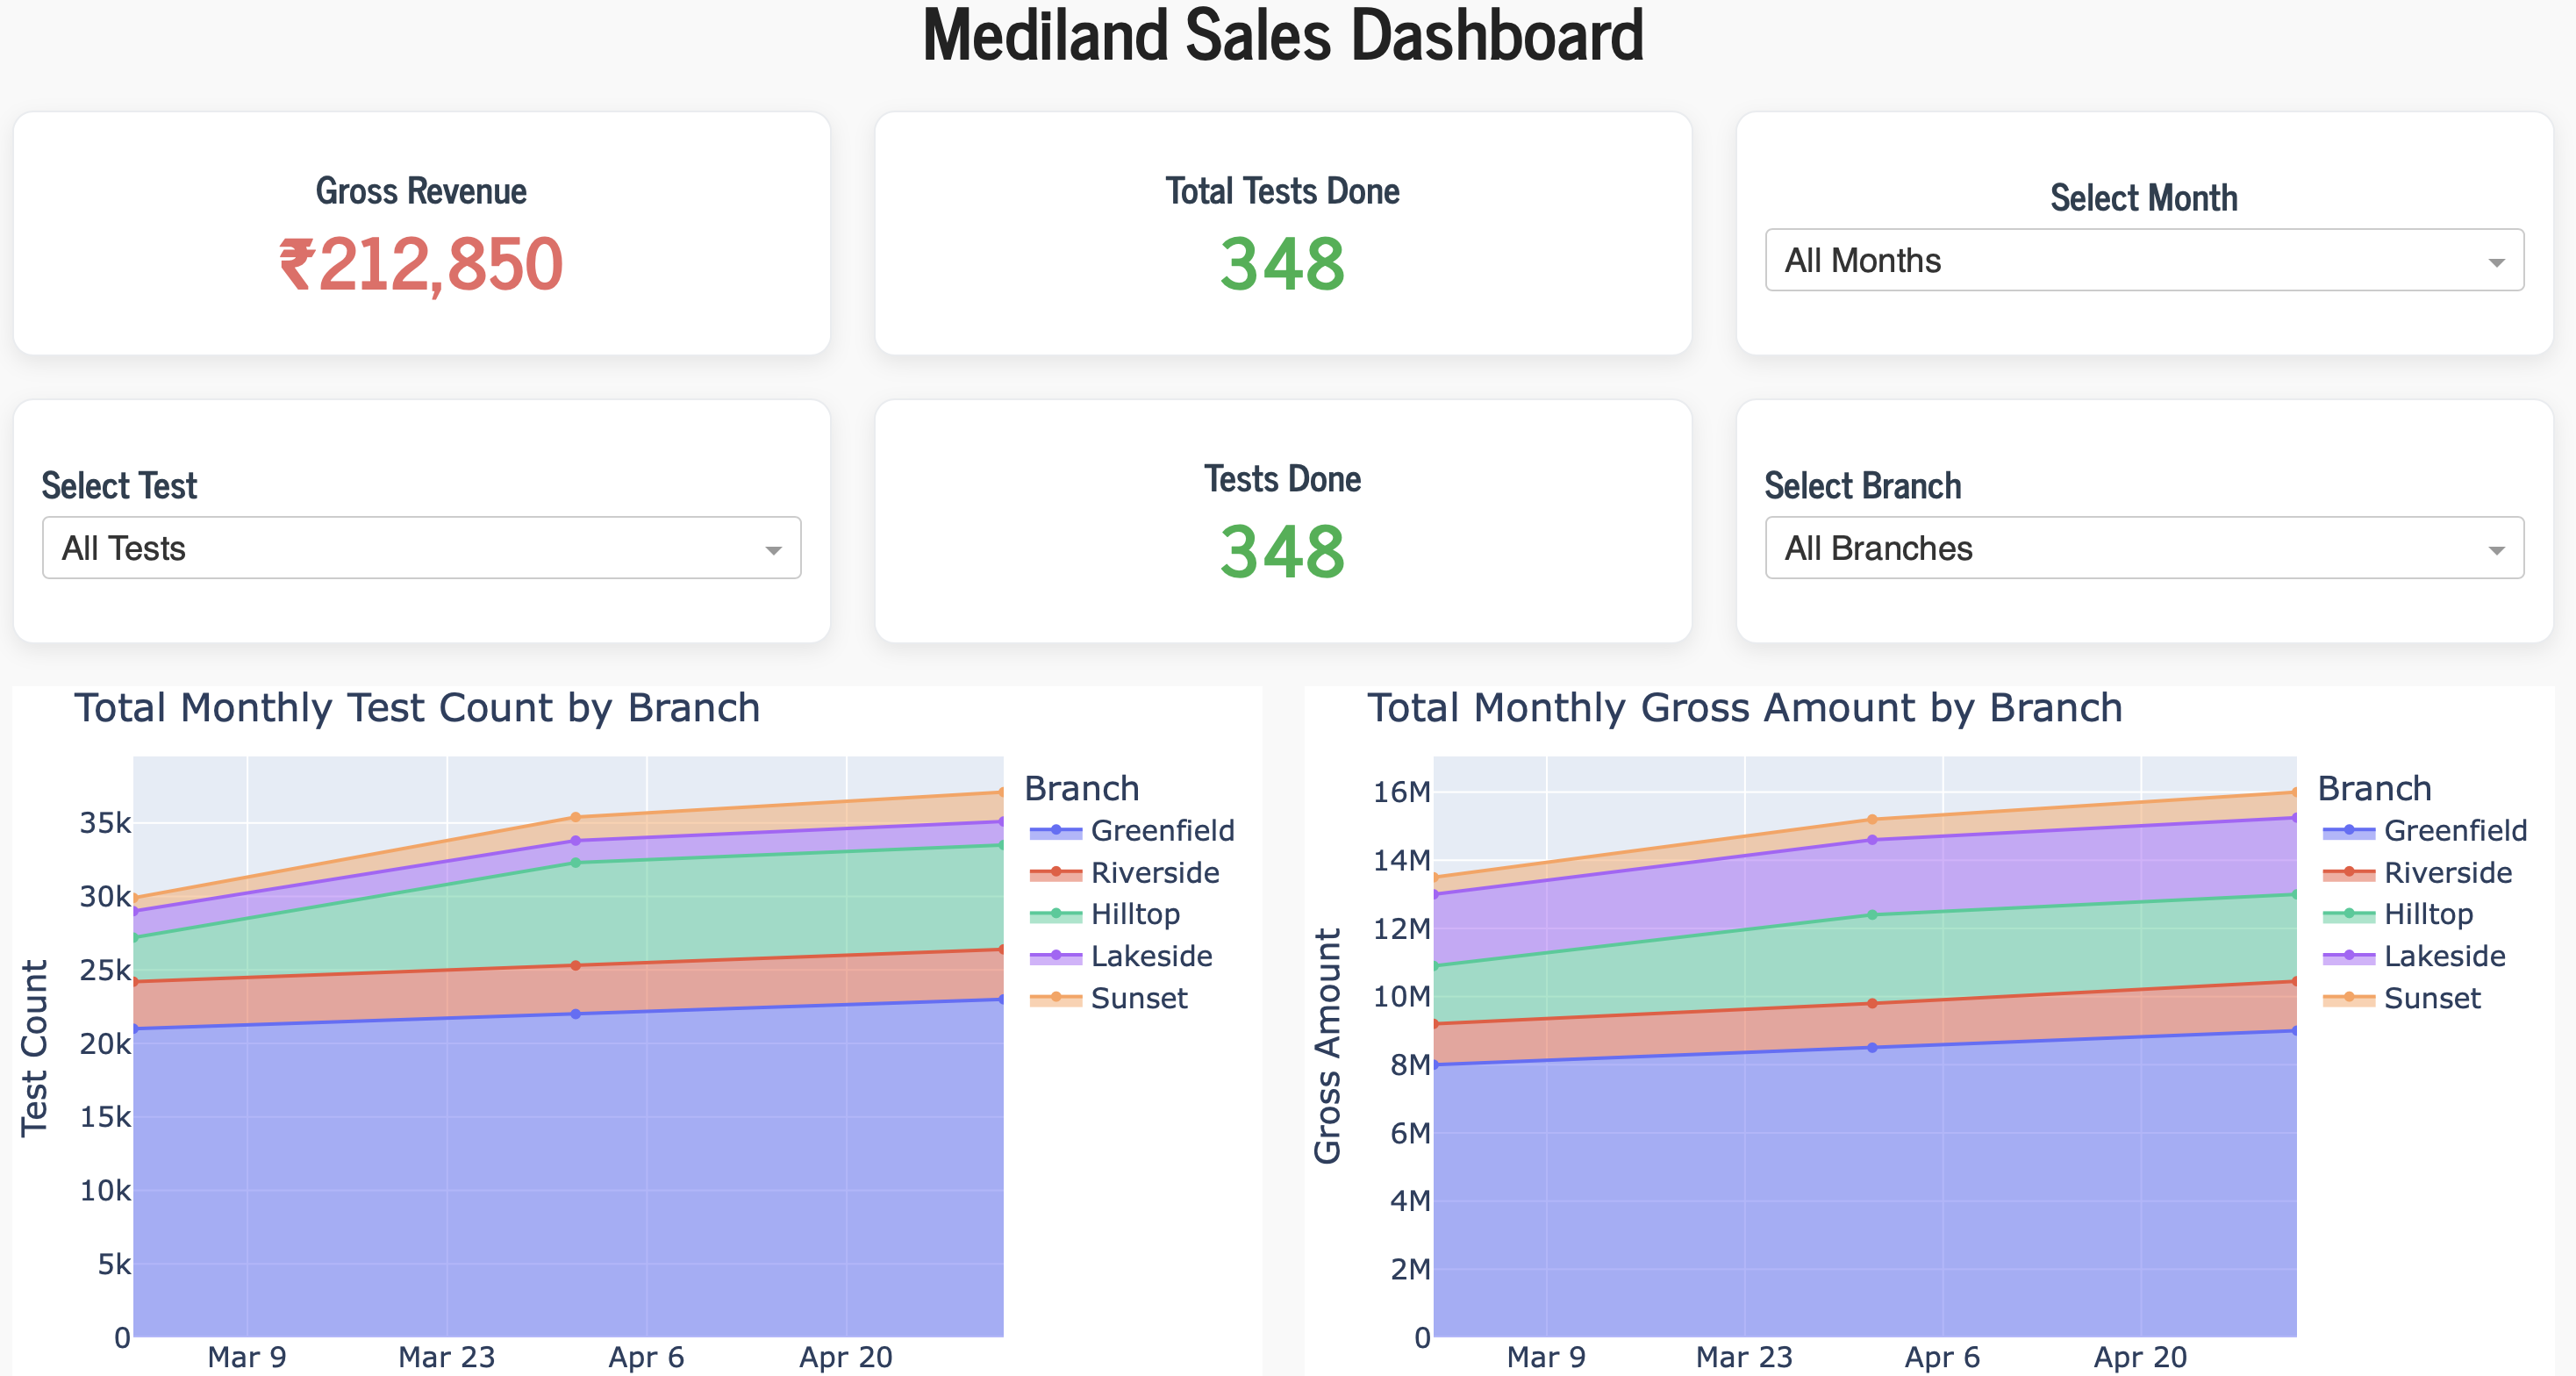
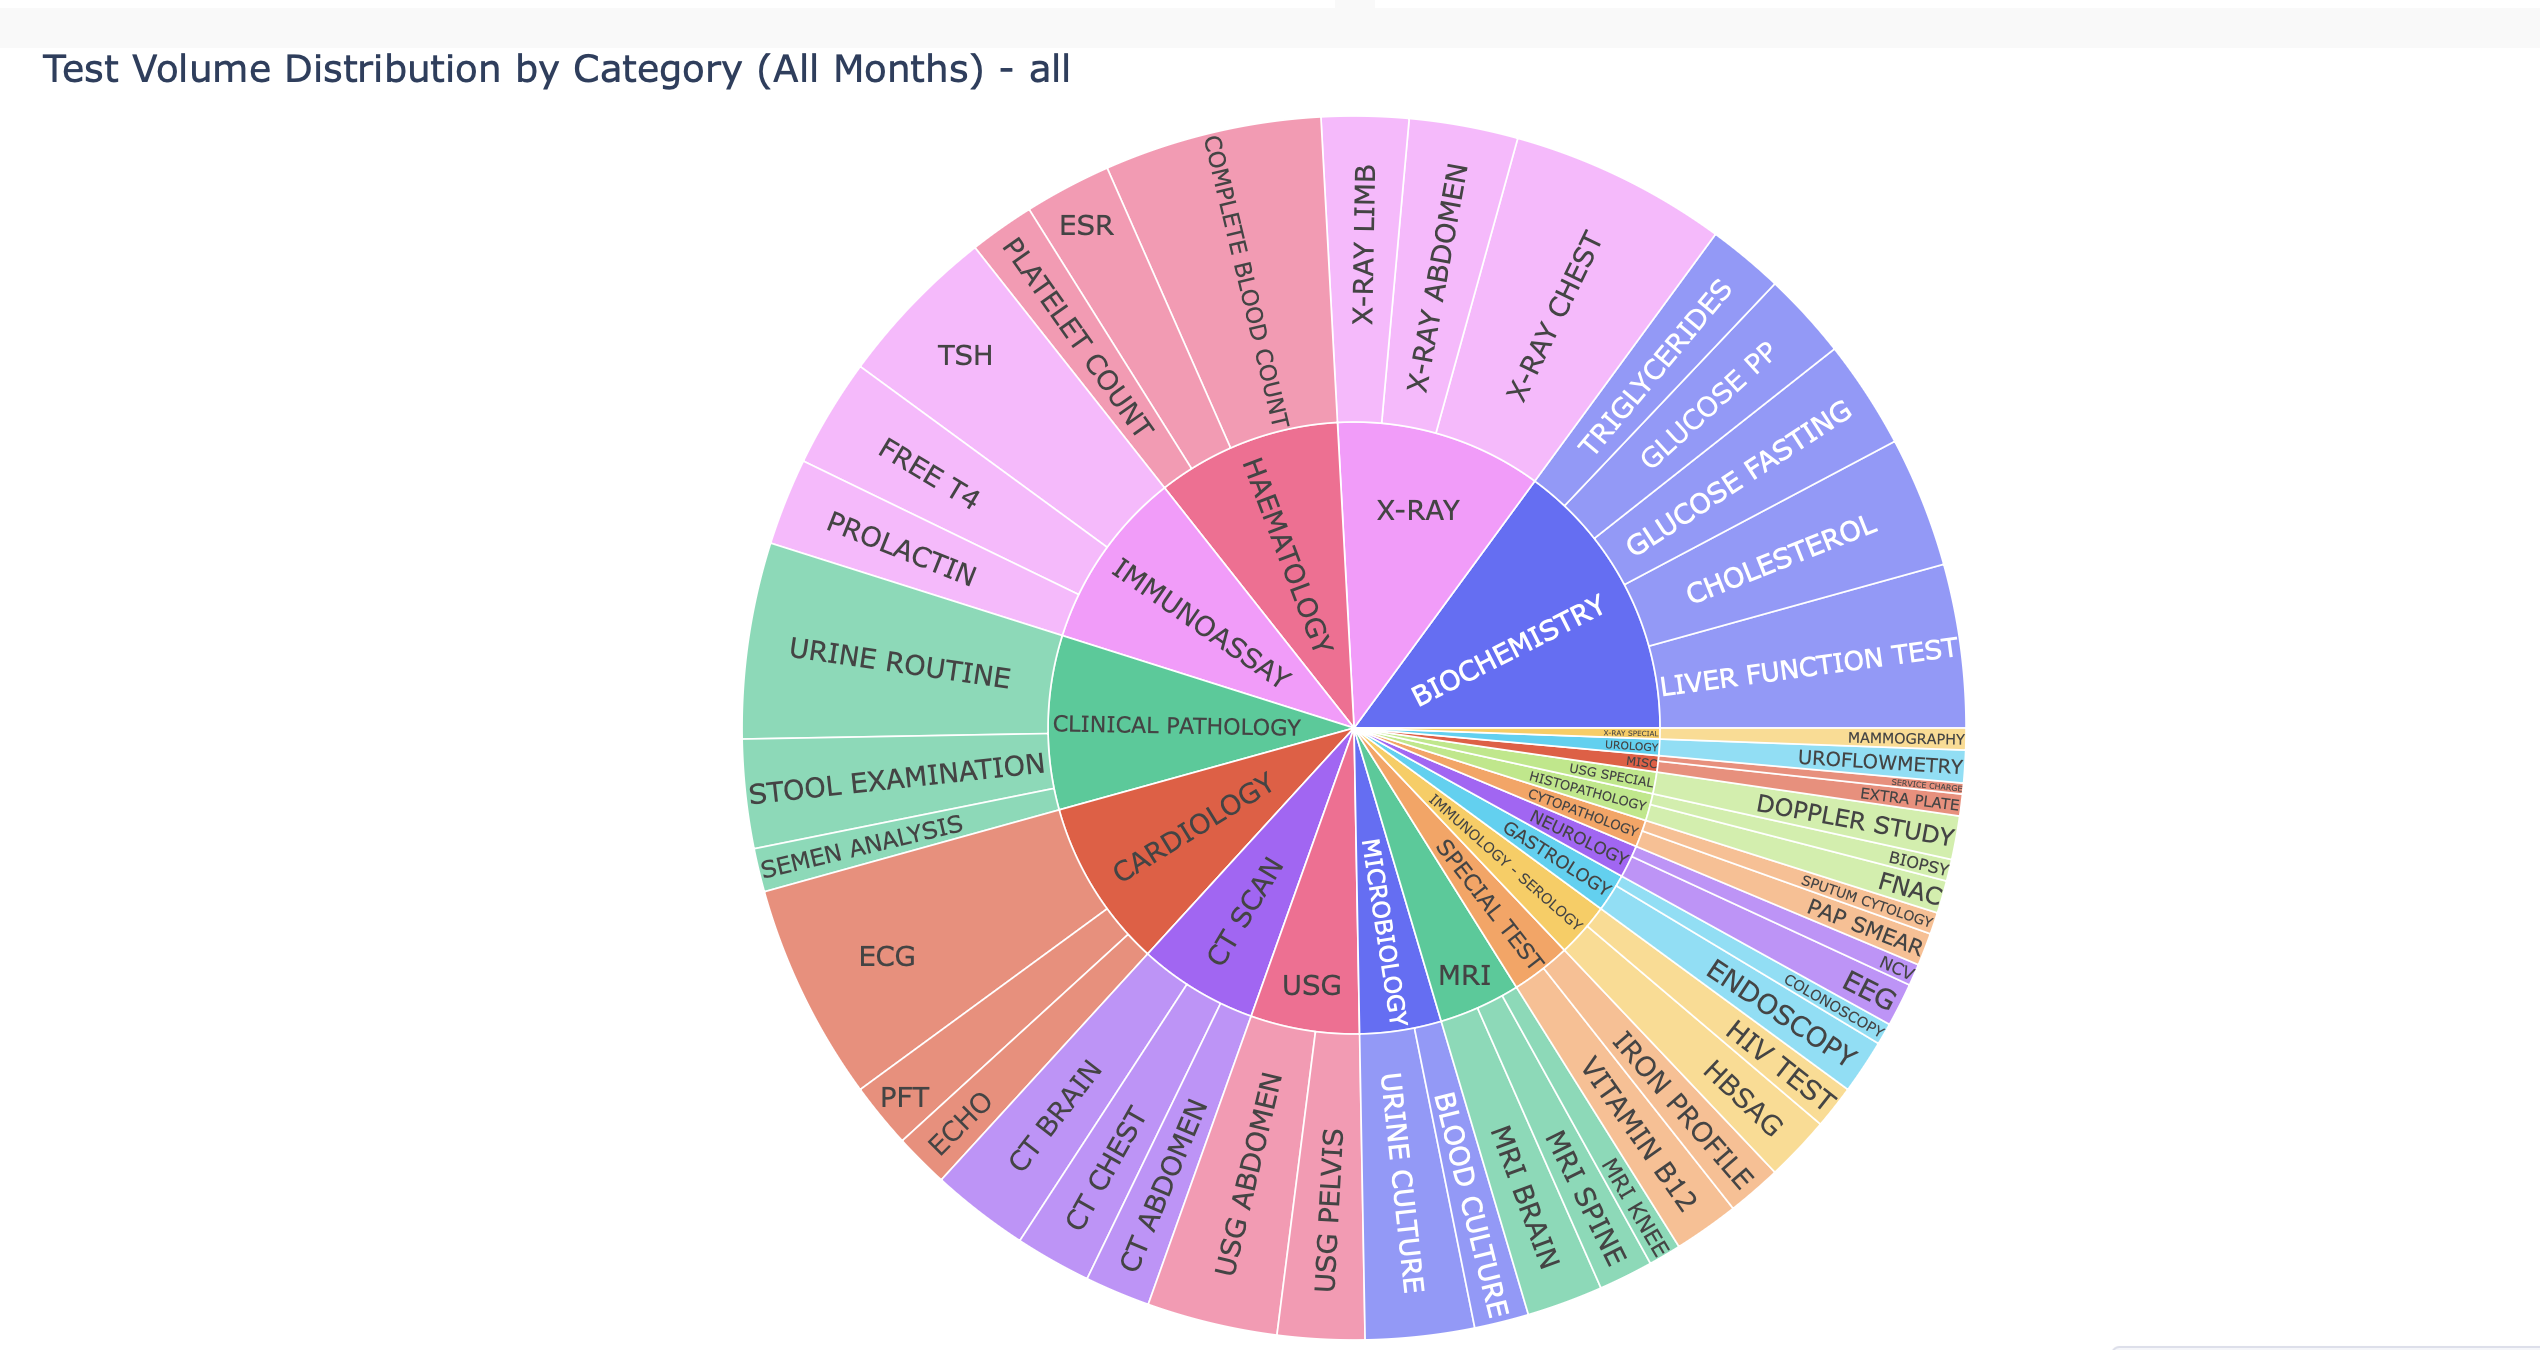
An interactive sales dashboard for Mediland Diagnostic Centre, built using Plotly Dash. The dashboard visualizes sales data, tracks key metrics, and provides actionable insights for business decision-making. Hosted on Render for seamless deployment and accessibility. It is in active use by Mediland, a diagnostic centre with over 25 years of experience. The graphic below uses representative data to maintain confidentiality.
Features
- Interactive charts and graphs for sales analysis
- Real-time filtering and data exploration
- Containerised using Docker
- Key performance indicators (KPIs) at a glance
- Secure, web-based access for stakeholders
Technology Stack
- Dashboard Framework: Plotly Dash (Python)
- Data Processing: Pandas
- Deployment: Hosted on Render
Architecture
The dashboard is designed for flexibility and scalability:
- Data: Processed and analyzed with Pandas
- App: Built with Plotly Dash for interactive visualizations
- Deploy: Hosted on Render for reliable, scalable access